Grafikler
Rapor Sihirbazı’nda kampanyaların metrik verilerini görselleştirebilirsiniz: gösterimler, tıklamalar, CTR, harcamalar, dönüşümler ve diğerleri; ve grafiklerde değişim eğilimlerini hemen görebilirsiniz.
Video görüntüleme
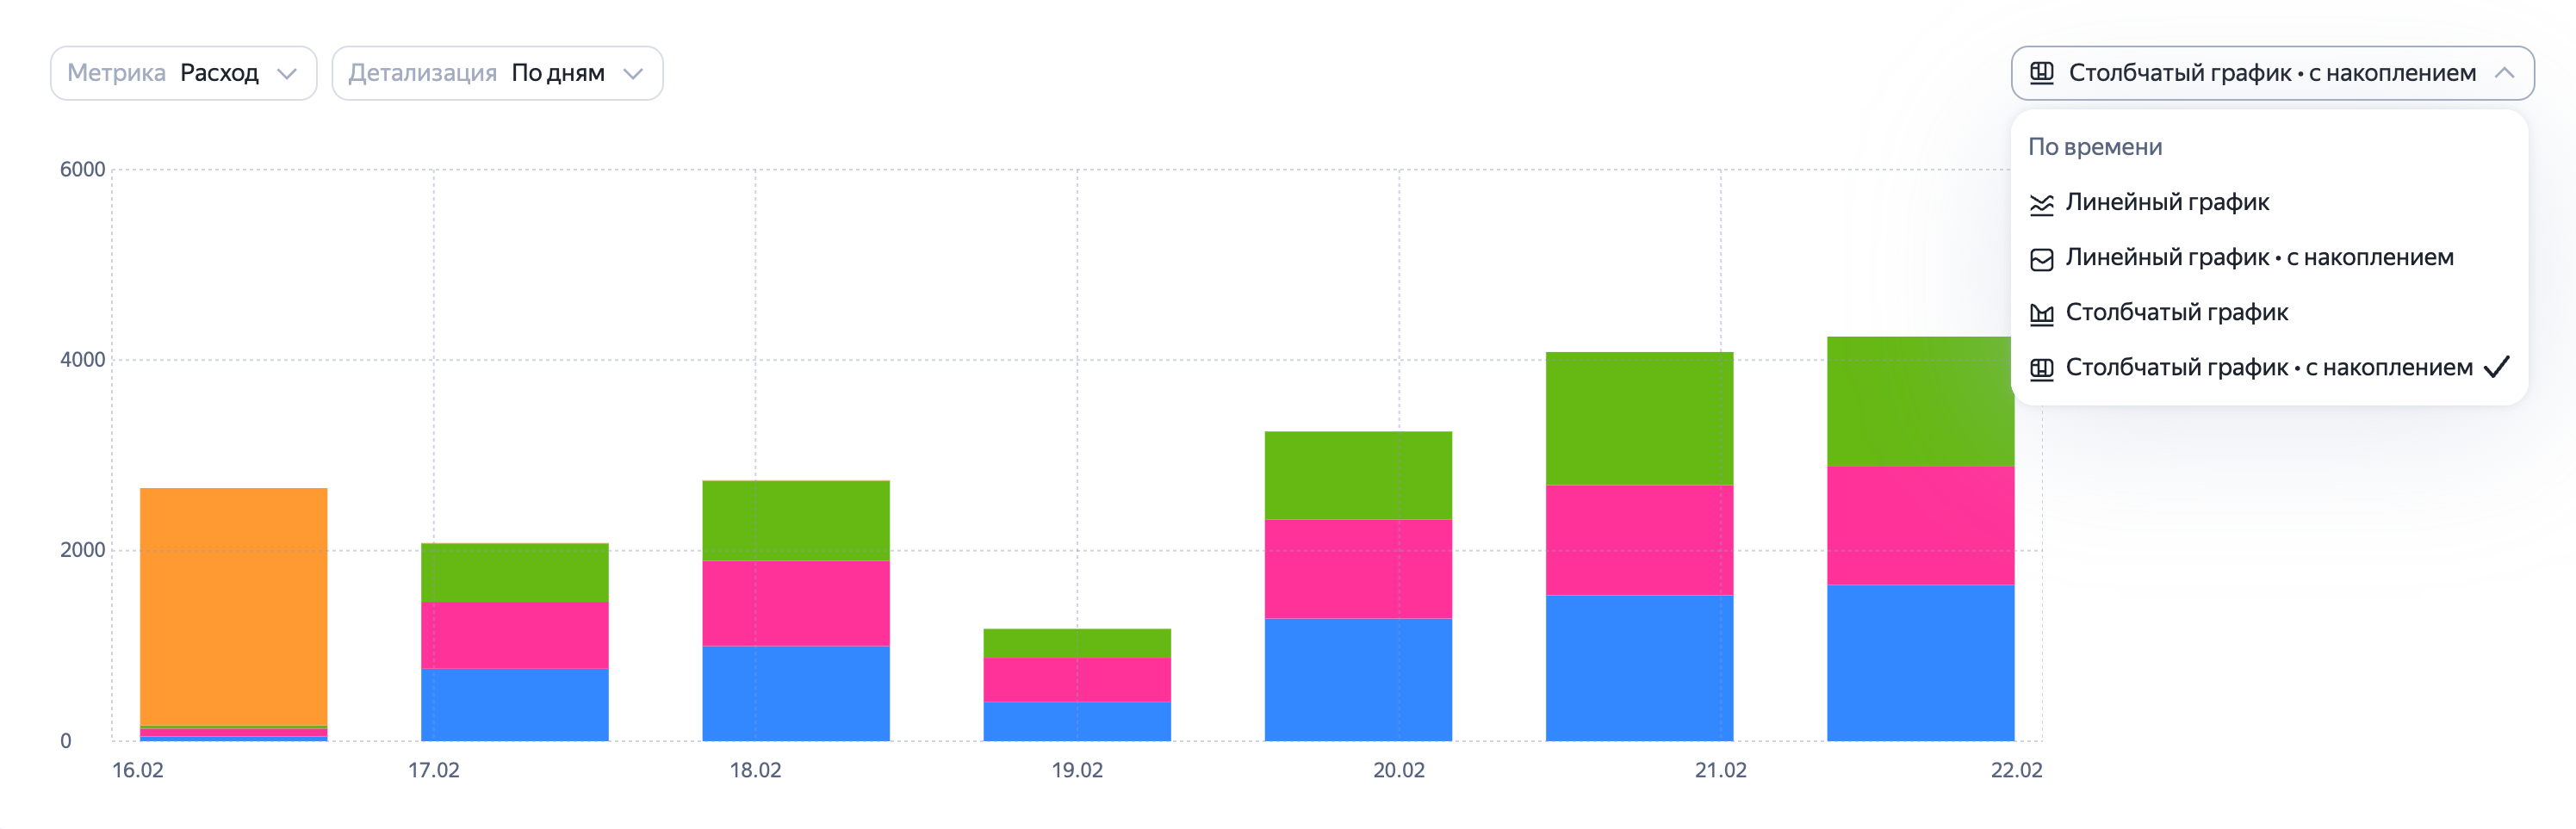
Grafik türleri mevcut:
- Doğrusal.
- Birikimli doğrusal.
- Sütunlu.
- Birikimli sütunlu.
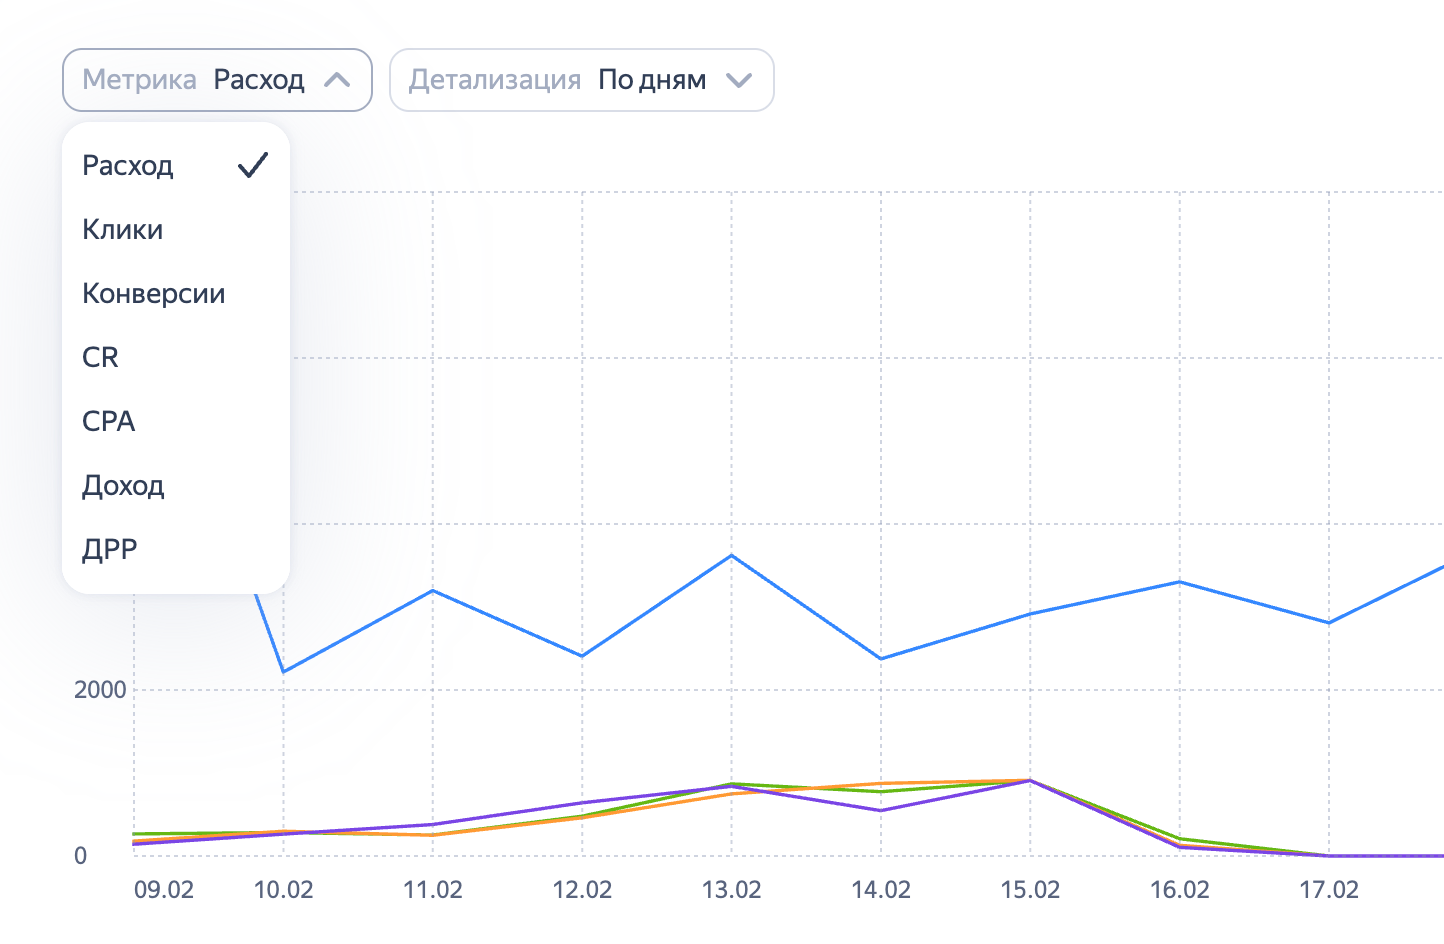
Açılan listede Metrikler seçeneğiyle grafikte gösterilecek göstergeleri belirleyebilirsiniz. Doğrusal ve sütunlu grafikleri için aynı anda en fazla beş metrik kullanılabilir.
Grafiklerde birikim varsa sadece bir metrik seçilebilir. Sistemin verileri bu metriğe göre toplayabilmesi için metrik toplamsal olmalıdır. Örneğin, harcama, tıklamalar ve gösterimler için birikimli grafikler mevcutken, CR, CTR veya CPA için değil.
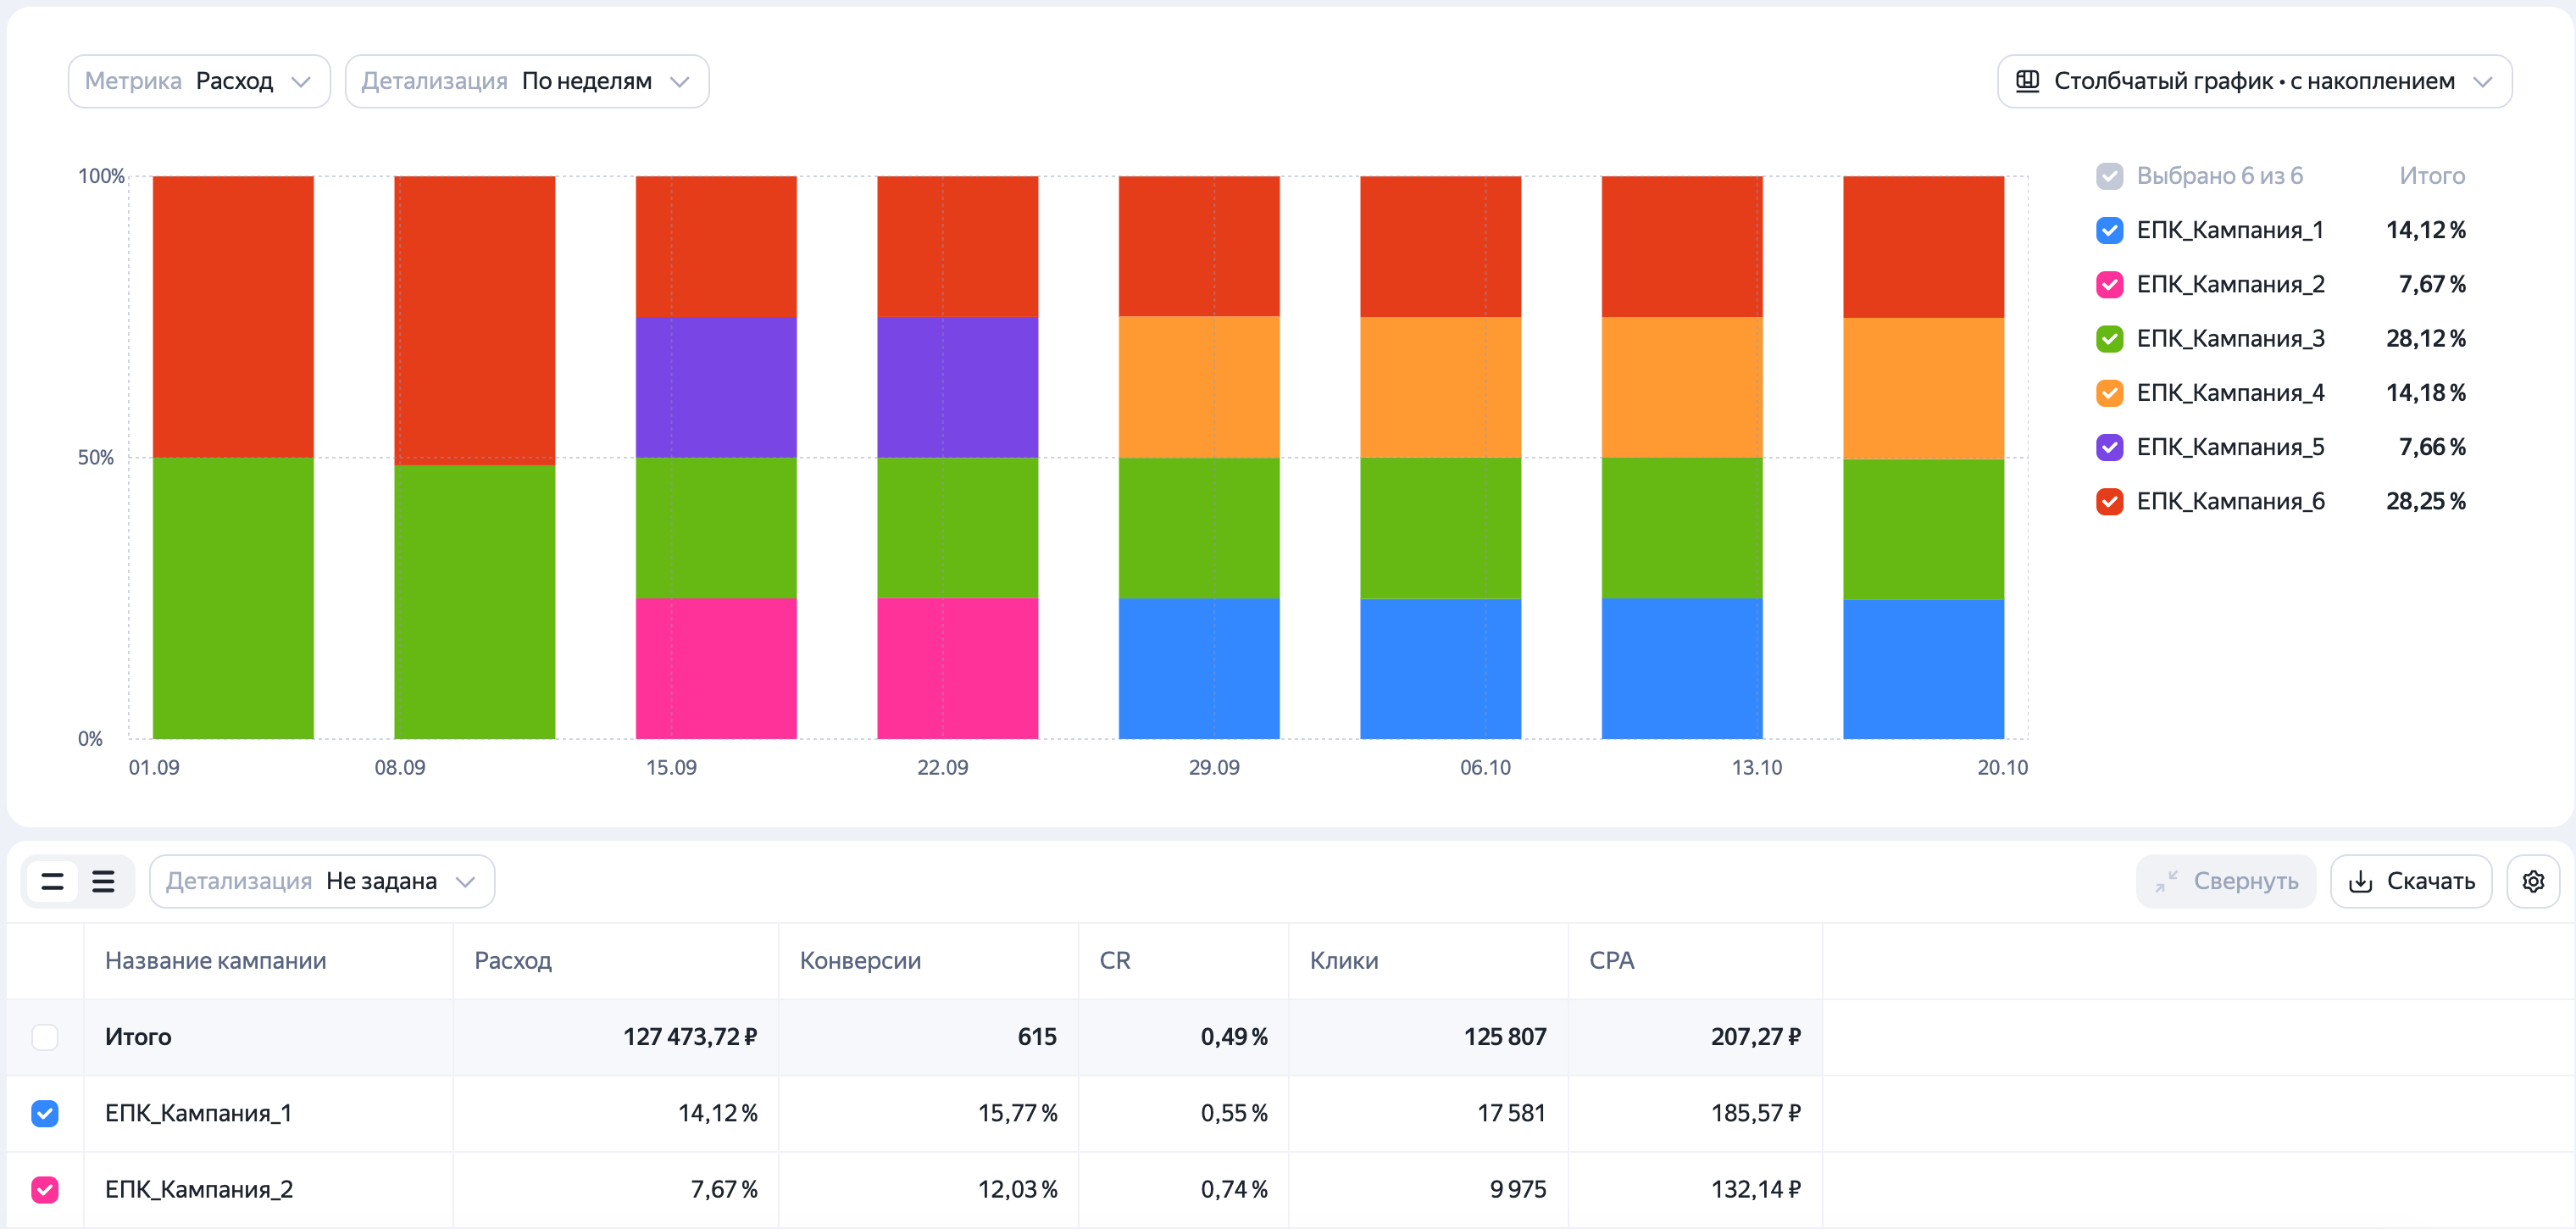
Birikimli grafiklerle yalnızca toplam verileri görüntülemekle kalmaz, verilerin yüzdelik dağılımını gösteren normalleştirilmiş bir grafik de oluşturabilirsiniz. Bunun için metrik içeren sütunun ayarlarında, görüntüleme seçeneğini mutlak değerlerden yüzdelere değiştirin.
Kullanılabilir metrikler, veri tablosuna eklenenlerle uyumludur. Eğer grafikte ek metrikleri göstermek istiyorsanız, bunları rapor tablosuna Gruplama ve metrikler seçeneğiyle ekleyin.
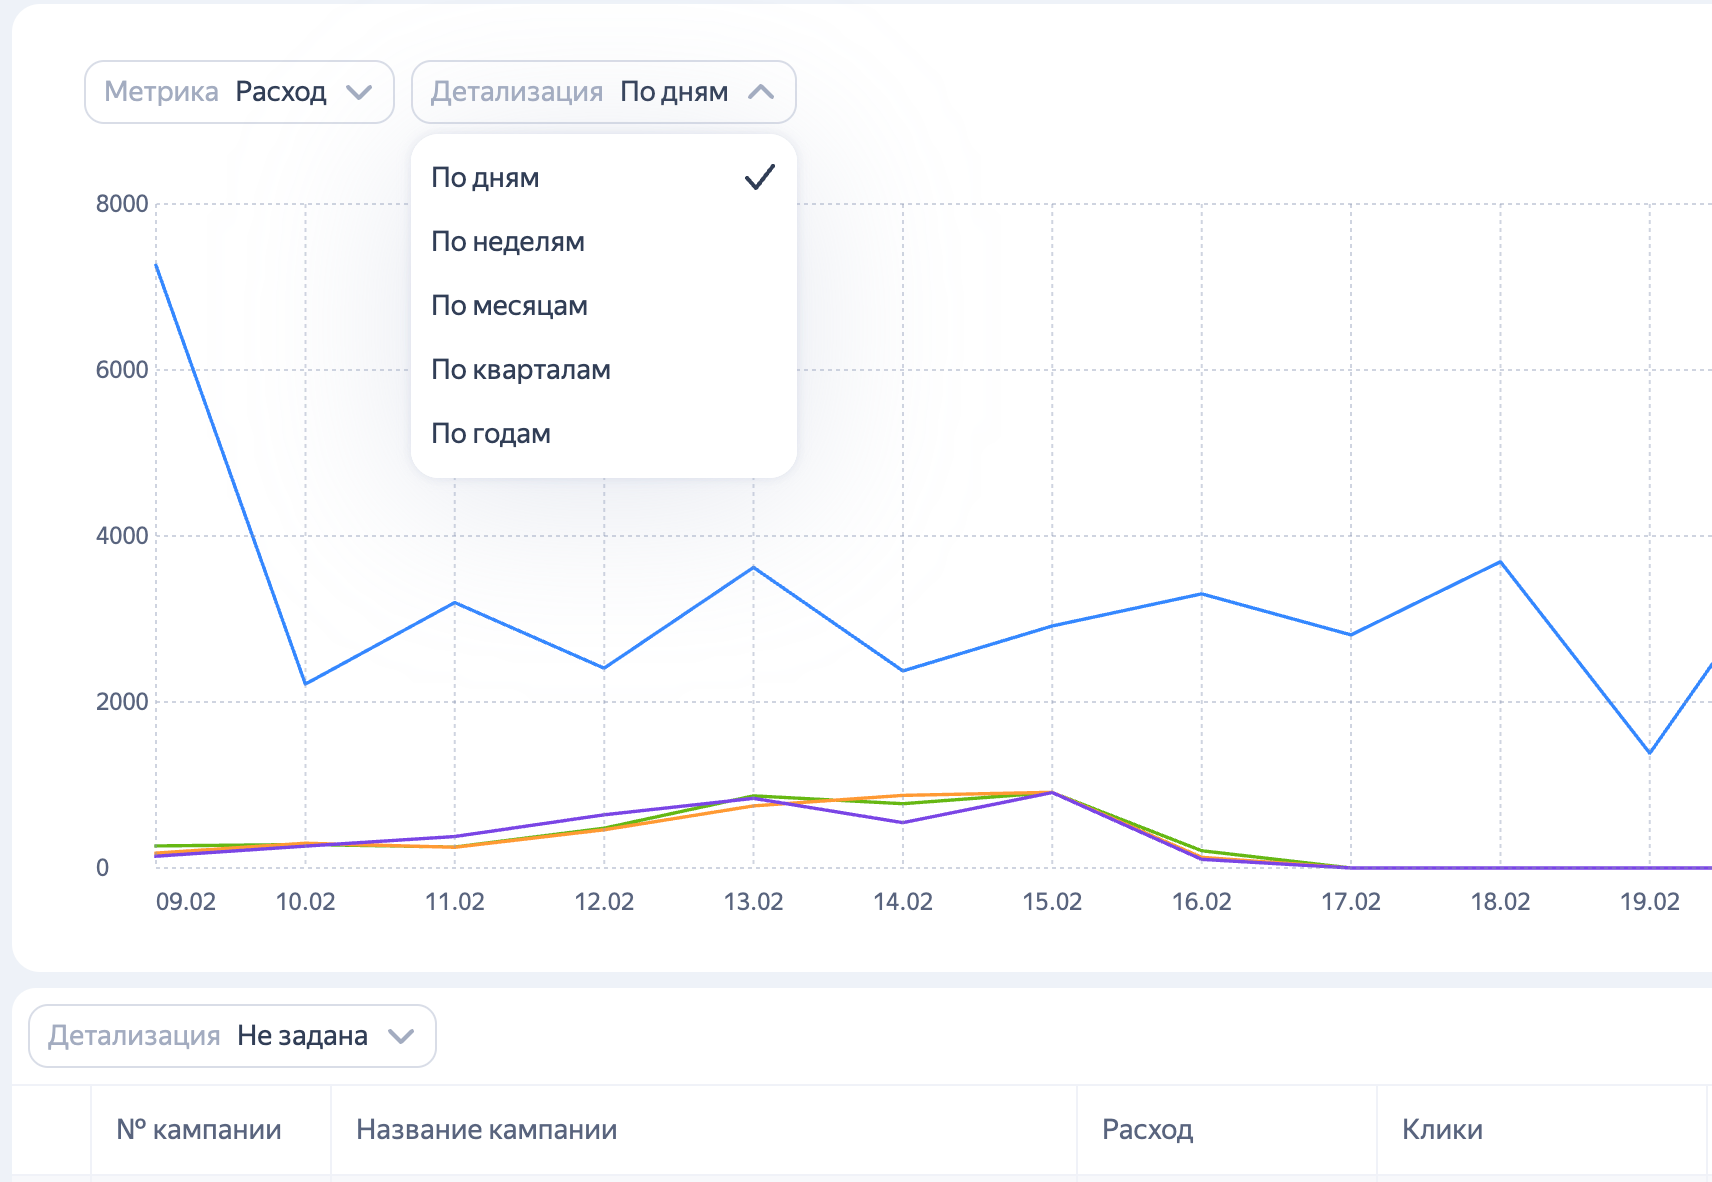
Ayrıntı düzeyini grafiğin üzerindeki ayarlardan değiştirebilirsiniz. Lütfen dikkat edin: bu sadece grafiğe verilerin görüntülenmesini etkileyecektir. Rapor tablosundaki ayrıntılar aynı kalacak.
Grafikte hangi verilerin gösterileceğini yönetmek için, rapor tablosundaki veya grafiğin sağındaki listedeki onay kutularını kullanabilirsiniz.
Video görüntüleme
Başka sorunuz var mı?
Dikkat
Müşteri Hizmetleri uzmanı, siz hangi kullanıcı adından iletişime geçtiyseniz yalnızca o kullanıcı adından başlatılmış olan kampanyalarla ilgili danışmanlık verebilir. Kullanıcı adı, ya.ru’yu komşu tarayıcı sekmesinde açarsanız görülebilir. Uzman, verilerinize yalnızca talebi işlerken erişebilecektir.
QR kodunu tarayın veya bağlantıya gitmek için koda tıklayın.