Click map
The click map measures and displays statistics for clicks on your site. The map displays clicks on all the page elements (including ones that are not links). In addition to seeing how users interact with a single page, you can view aggregated statistics for a group of pages. For example, you can get statistics for a specific section.
Ways to use the map
The click map helps you evaluate the overall usability of your website, identify the most popular sections, and see which parts of the design users mistake for links.
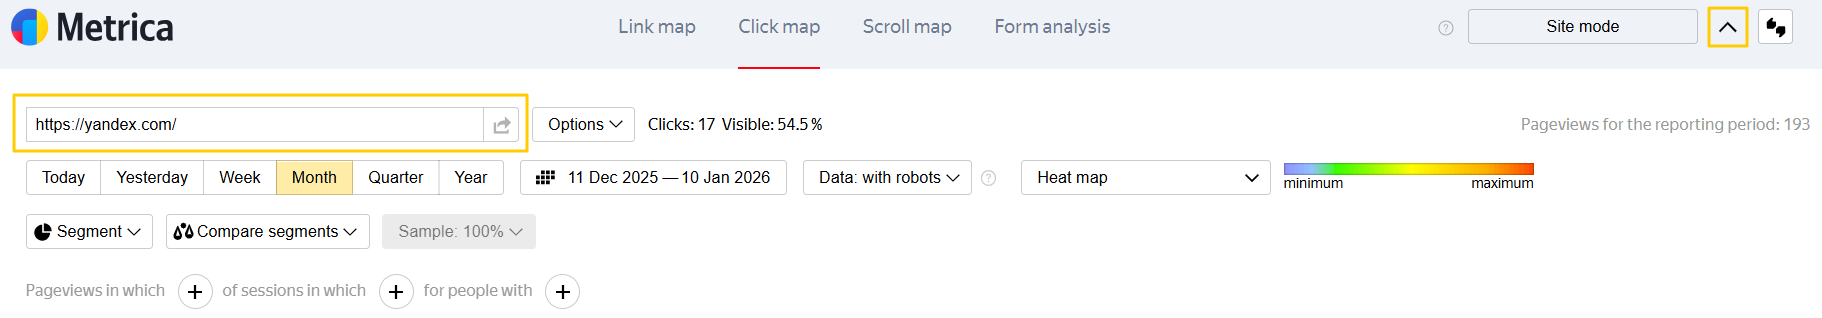
Elements are color-coded to indicate how frequently they’re used. The map shows the total number of clicks on the page (or group of pages) and the percentage of clicks in the area currently visible to you.
You can use multiple map display modes:
-
“Heat map” — Warm colors correspond to frequent clicks, and cool colors correspond to rare clicks.
-
“Monochrome map” — The denser the color, the higher the click frequency.
-
“Clicks on links and buttons” — The map only shows clicks on links and buttons. It doesn't show clicks on other elements.
-
“Transparency map” — The click map is displayed as a “fog screen”: the most frequently clicked elements are most visible through the “fog”.
-
“Element map” — The map shows all the elements on a page.
Note
- The map is only displayed on those pages of the site where the Yandex Metrica tag is installed, and also if the site uses UTF-8 encoding.
- You can view statistics for a year or a shorter time period.
- When building the map, elements such as
www, advertising tags, and the part of the link after#(inclusive) are excluded from the URL, but regular URL parameters are not excluded. This is why the click maps for the pageshttp://example.com?id=1andhttp://example.com?id=2will be different. - Internet Explorer versions 8.0 and earlier are not supported.
- Report generation uses the general sampling algorithm to regulate the data volume. The report will contain a maximum of 100,000 events, regardless of sampling.
Connecting
- In Yandex Metrica, go to Settings → Tag.
- Select the Session Replay, scroll map, form analysis option.
- Save the changes.
- Install the updated tag code on all the site’s pages.
Note
The map may be disabled if it hasn’t been viewed in the past six months. To resume session recording, enable the option again.
Statistics on a group of pages
To view statistics for a group of pages, you can use extra characters in the URL box.
Characters used for displaying statistics
|
Character |
Description |
Example |
|
* |
Matches any number of any characters |
Display data for all pages with URLs that start with https://example.com/goods/, including the specified page: If you enter the address without extra characters, Metrica will offer a drop-down suggestion with the * character |
|
~ |
The condition is a regular expression |
Show data for pages with a URL matching a regular expression. For example: |
Let’s look at an example. You need to get statistics on pages in the directory https://example.com/goods/. In order for this data to be shown on the map, enter https://example.com/goods/* in the address box (after you enter it, the same address is shown in the drop-down suggestion). Data is loaded automatically.
The map will be displayed on the most popular page with a URL that matches what you specified. Numeric indicators (number of page views, clicks, and the percentage of visible clicks) will be combined for all the pages that match the condition.
Showing data in an iframe
If your site is protected from being shown in an iframe (the X-Frame-Options header is used in the server settings), you won't be able to view the collected data. To view the site’s session data, use a regular expression in the server settings to add exceptions for the following domains:
- your website
- metrika.yandex.ru
- metrika.yandex.by
- metrica.yandex.com
- metrica.yandex.com.tr
- webvisor.com and its subdomains
^https?:\/\/([^\/]+\.)?(yourdomain\.com|webvisor\.com|metri[ck]a\.yandex\.(com|ru|by|com\.tr))\/
If you use nginx, add the following exceptions to your configuration:
location / {
        set $frame_options '';
        if ($http_referer !~ '^https?:\/\/([^\/]+\.)?(yourdomain\.com|webvisor\.com|metri[ck]a\.yandex\.(com|ru|by|com\.tr))\/'){
            set $frame_options 'SAMEORIGIN';
        }
        add_header X-Frame-Options $frame_options;
        ...
    }
where yourdomain\.com is the site's domain name. Use your site’s domain zone (it may differ from .com).
Page size restriction
In order to display data on the map, the website pages must meet certain size restrictions. The values below are for displaying the map in various browsers:
|
Browser |
Maximum page height/width (in pixels) |
Maximum number of pixels |
|
Mozilla Firefox |
32,767 |
472,907,776 (22,528 x 20,992) |
|
Chrome |
32,767 |
268,435,456 (16,384 x 16,384) |
|
Internet Explorer |
8,192 |
67,108,864 (8,192 x 8,192) |
Questions and answers
Click map, link map or scroll map page loads endlessly
In Safari 12 and higher, the click map, link map, or scroll map page may never finish loading due to an option in the browser settings.
- Go to the Privacy tab and disable the Prevent cross-site tracking option.
- Restart the browser and open the maps again.
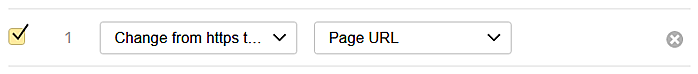
When a request is made, a “No data” notification appears in the map
This can happen if in the tag settings on the tab Filters the action Change from https to http is enabled. In this case, all URLs with HTTP protocols are on the map, and the site itself has the HTTPS protocol.
To start displaying the data, disable the operation.
|
Useful links |
Online training |