Page load time
This report lets you analyze the speed at which site pages are loaded. A browser loads pages in several stages. The loading speed may decrease at any one of the stages.
To view the report, go to Reports → Monitoring → Page load time.
An example of this report is available for the Yandex Metrica demo tag.
Ways to use this report
Learn your average website load time
To determine how long it takes to fully load a single page, check the DOM loading time metric. To learn the total loading time for all pages on your website with a tag installed, check the field that says Total and average.
Determine how much time it takes to load one page
To determine how long it takes to fully load a single page, check the DOM loading time metric. To determine the time it takes to load a specific page, select the segment that corresponds to that page:
- Find the Load speed of sites for which condition group and click .
- Select the View URL condition and enter your page address in the field.
To see page loading dynamics, select the “Lines” chart.
Check your Turbo site's page loading speed
If the same Yandex Metrica tag is installed on your main site and Turbo site, select the segment:
-
Find the Load speed of sites for which condition group and click
 .
. -
Select the Turbo condition.
Determine the loading speed of your website from different locations across the world
First, select the desired regions:
- Click Dimensions → Audience → Geography.
- Select the necessary indicators. For example, City, Country.
Now the report can show metrics for each region separately.
Report structure and settings
In the report, data is interpreted using a quantile. By default, the 50% quantile is selected. This means that 50% of the time, page loading time is less than shown in the report. The 90% quantile means that download time will not exceed the time shown in 90% of cases.
For example, if we take ten random loadings of a page, on average nine of them will load faster than the time shown in the report, and one will take longer.
You can set the desired quantile yourself. The higher it is, the more likely that the user can load the page in the time specified in the report.
The metrics in the report correspond to the stages of page loading, as well as show load time.
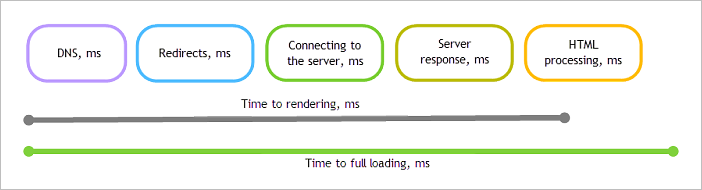
-
DNS (DNS request processing): Time spent processing requests to the DNS server when loading a page. Only values with non-zero times are counted.
This parameter is affected by the speed of the DNS servers that handle requests to the site’s domain.
-
Redirects (processing redirects): Time spent processing HTTP redirects when loading a page. Only values with non-zero times are counted.
-
Time to establish connection: How long the browser waited for a connection to the HTTP server when getting page content. Only values with non-zero times are counted.
This parameter is affected by network latency between a user and the site, as well as by how heavily loaded the site is with incoming requests.
-
Server response: How long it took to send a request and get a response with page contents from the HTTP server to the browser. Only values with non-zero times are counted.
This parameter is affected by how quickly the response is generated by the web server, the page size, and the speed of data transmission between a user and the web server.
-
HTML load and parsing time: Time it takes for the browser to process the page contents after downloading it from the server and before rendering.
This parameter is affected by the size and complexity of the HTML page (complexity includes the number of tags and how many nesting levels there are).
-
DOM load time: Time from the moment the user clicks to open the web page until the page and all its components (images, CSS, and scripts) have fully loaded. The maximum displayed value for this metric is 30 seconds.
-
Time to rendering: Time from starting to go to the page until the page starts being rendered in the browser. This is the value that users subjectively perceive as the site’s loading speed. This usually takes less than 2 seconds.
Time is shown in seconds. Since the loading speed may depend on the browser, we recommend using segmentation by browser. When optimizing loading time, pay attention to the parameter that is most time-consuming and optimize it first.
For information about configuring reports, see Report settings.
|
Useful links |
Online training |